| Business Insights is a tool that allows for employees that are more analytical to see the data in Sage 100 in a format that may provide more insight than through the screen forms. Someone comfortable with Excel Pivot Tables should feel at home, although this has nothing to do with pivot tables the feel with data in different panels is similar.
The purpose of this outline is to drive understanding with examples. Our goal is to start with a brief overview of the module with the navigation of the screens and toolbars, then three examples. |
Access to the Explorer views can be done within the modules or from the Business Insights module. Each module will have just the views that pertain to that module, so if you want to provide rights to certain views that can be done, and the users rights will be managed by user security.
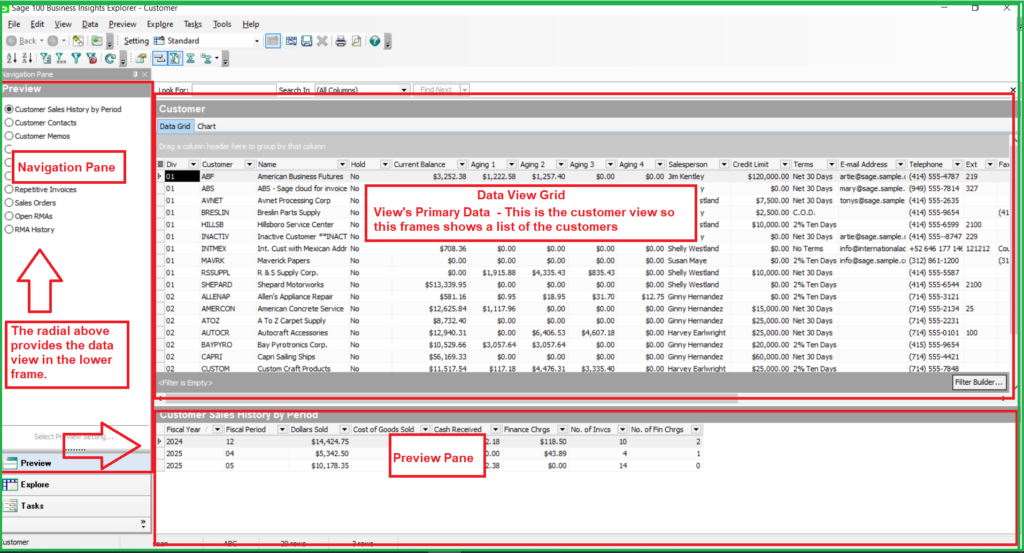
Let us start the process by looking at customer view – Look below at the screen, and I will review the Windowpanes.
The Business Insights Explorer window has three major areas:
- Navigation Pane
- Data View Grid
- Preview Pane.
All these areas provide ways to navigate to related data or preview information for the selected view.
TOOL BARS (VIEW, EXPLORER, DATA,TOOLS)
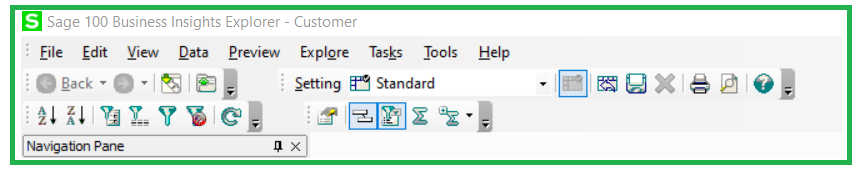
Figure 2 – Tool Bars
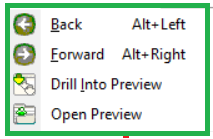
VIEW
- Back – Acts like a webpage back -allows from going back after drilling into the data.
- Forward – Same as above – moves forward in the data.
- Drill – Drills into the preview for the record you are on in Data View Grid
- Open Preview – opens all records in the Data View Grid
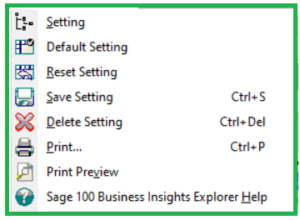
EXPLORER
- Settings – Allow for saving changes made to a view.
- Default Setting – First view, each view can have many saved versions.
- Reset – can put standard back as default view.
- Save Setting – Allows for the changes to be saved.
- Delete Settings allows for views no longer needed deleted.
- Print – Allows you to print the view.
- Print Preview Allows you to view before printing.
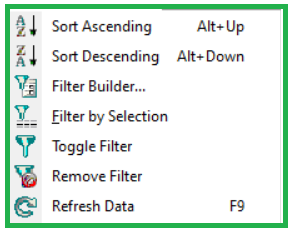
DATA
- Sort Columns Ascending in Data View Grid or Preview Pane
- Sort Columns Descending in Data View Grid or Preview Pane
- Filter Building – build filters to apply to the data in the Data View grid
- Filter by selection – Uses current record to filter other record.
- Remove Filter – Brings Data Grid back to settings view.
- Refresh Data – Can be used if View has been on
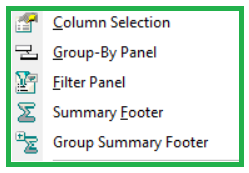
TOOLS
- Column Selection – To add columns back to the Grid View.
- Group by Panel – To group by any column
- Filter Panel – Shows the filter for the Data View Grid
- Summary Footer – To show the summary data values for the Data Grid View
- Group Summary Footer – To show summary data values by group.
Example One – Customer Open Invoice, Grouped by Division
- Open the Customer View – this can be done in the Accounts Receivable Module Explorer Menu or in the Business Insights Explorer Menu.
- Drag Division Column to the Group by Column Gray area – if the gray area does not show, click the button Group by Panel in the TOOLS bar.
- On the Navigation Pane – Preview – Select the Open Invoices radial.
- On the TOOLS bar select the Summary Footer and the Group Summary Footer – Notice new boxes appear for totaling the columns. Right click in each box and select the SUM function.
- Click on the Name Column and Sort Ascending
- Click the Save button on the Explorer Bar – Save as Customer Open Invoice- Grouped by Division, verify save as private setting.
- Select Print Preview – and review the results – Close print preview.
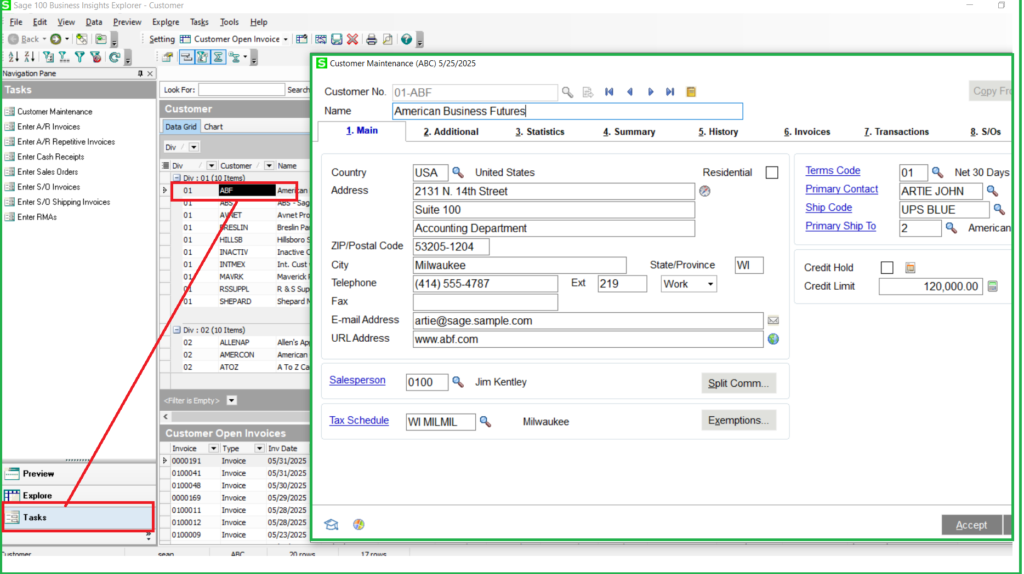
- Select Task on Navigation Pane – click ABF on the Data View Grid
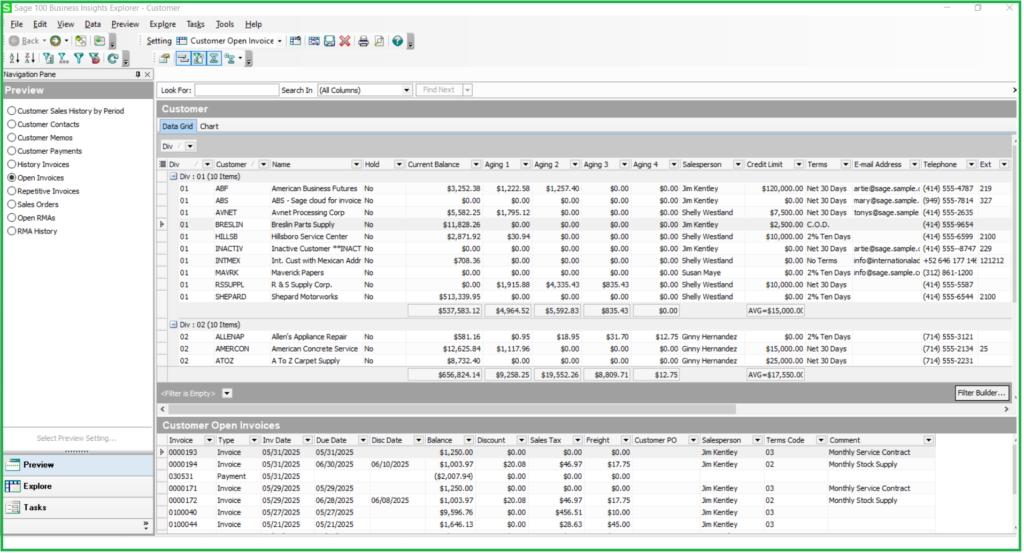
Figure 3 – Example 1 Finished Results
Print Preview – Results
Figure 4 – Example of Print Preview
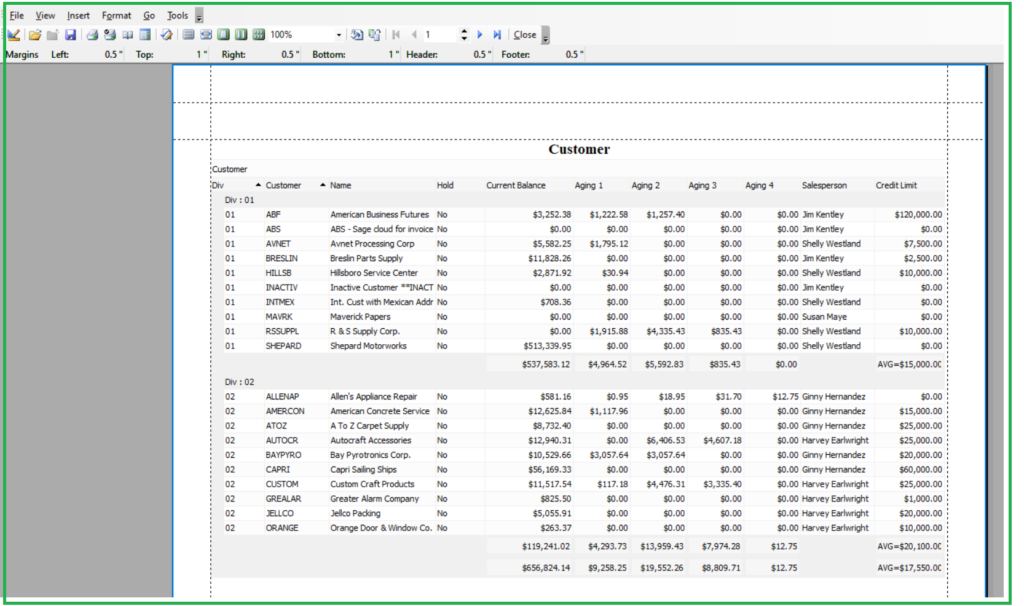
Figure 5 Example of Task – Launches Customer Maintenance from Within the View.
Example Two – Item Quantities by Warehouse
- Open the Item Quantities by Warehouse – this can be done in the Inventory Module Explorer Menu or in the Business Insights Explorer Menu.
- Drag Item Code Column to the Group by Column Gray area, then drag WHSE to the Group by Column too – if the gray area does not show, click the button Group by Panel in the TOOLS bar.
- On the Navigation Pane – Preview – Select the Item
- Click the Qty on WO, drag to the top of the screen, once you see an X, release it, the column should be removed from the Data Grid View, repeat, and remove: Qty Rec for WO, Qty In Shipping
- Select the Column Selection from the TOOL bar. Review the available fields.
- Add the Summary and Group Footer and sum across all columns except Average Cost – Use the Average function
- Save as Item Quantities by Warehouse and Review
- Select the Custom Filer review options.
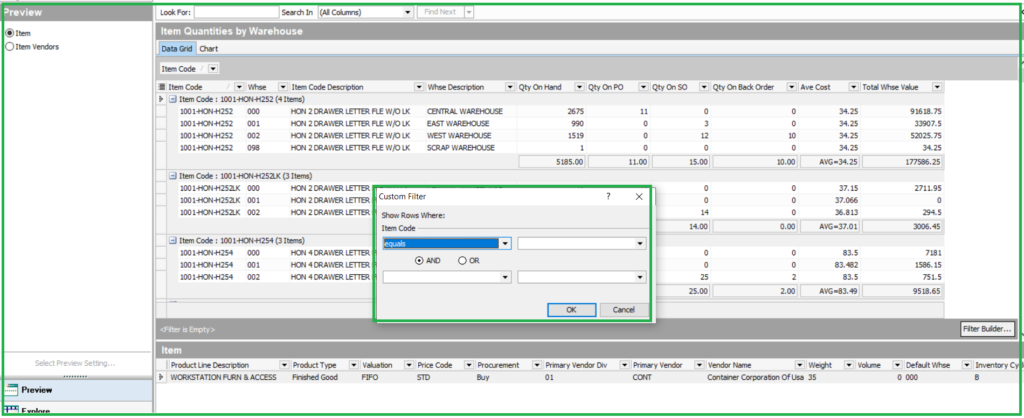
Figure 6 – Exercise Two Results
Example Three – Open and Back Order Purchase Orders
- Open the Purchase Order View – this can be done in the Purchase Order Module Explorer Menu or in the Business Insights Explorer Menu.
- Open the Column Selection and drag the Required or Expire Date to the Group by Selection, Sort field Ascending.
- Click Status, set Custom Filter to “does not equal” “X” (Complete)
- Save as PO by Expire Date
- On the Navigation Pane – review the radials – .
- Review the different columns, and delete the columns not needed.
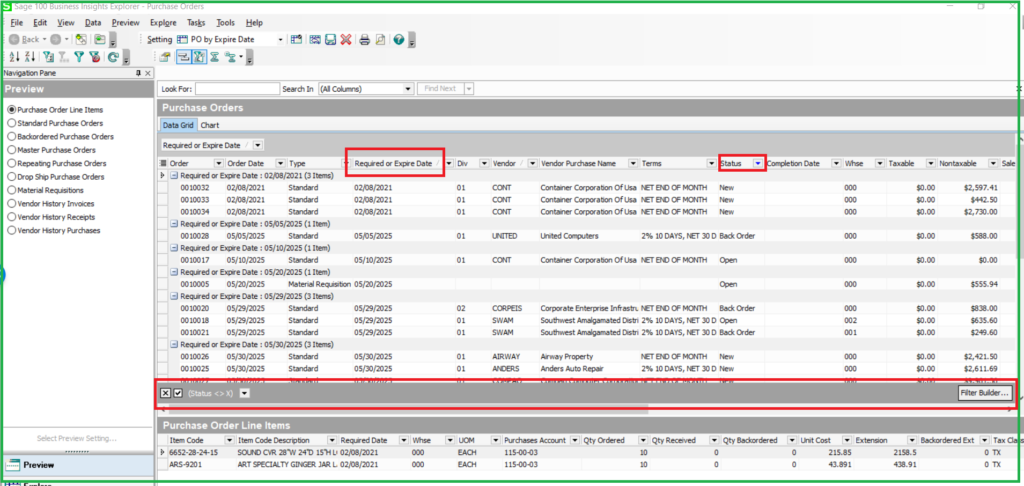
Figure 7 – Results of Example 3
Are you interested in more support? Contact us today to discuss our support plans at 856-335-1010