Dashboard Reporting Visualizations are becoming increasingly popular in the collaborative workspace. Deciding on adapting this system can be challenging for companies for are not aware of its benefits and features. To better understand what exactly dashboard reporting visualizations are, here is an in-depth and informative article with everything you should before making a purchasing decision.
According to TapClicks, A data dashboard is an information management tool that helps you capture, track, analyze, and visualize all your important key performance indicators and metrics as they relate to your business. It also connects files, attachments, services, and KPIs. This feature allows for multiple data sources because it provides one location to monitor and track performance. Having multiple data sources reduces the manual analysis of data and allows for better communication. It makes business processes more efficient and saves time.
Dashboard Reporting Visualizations allow you to see your data and analytics in an easier way through visualizing trends and occurrences. It is a tool that tracks, analyzes, and displays KPIs, metrics and critical data points. Non-high tech users can still understand the data behind their company’s needs. There are many reasons to implement dashboard reporting visualizations and below are the processes, types, and benefits.
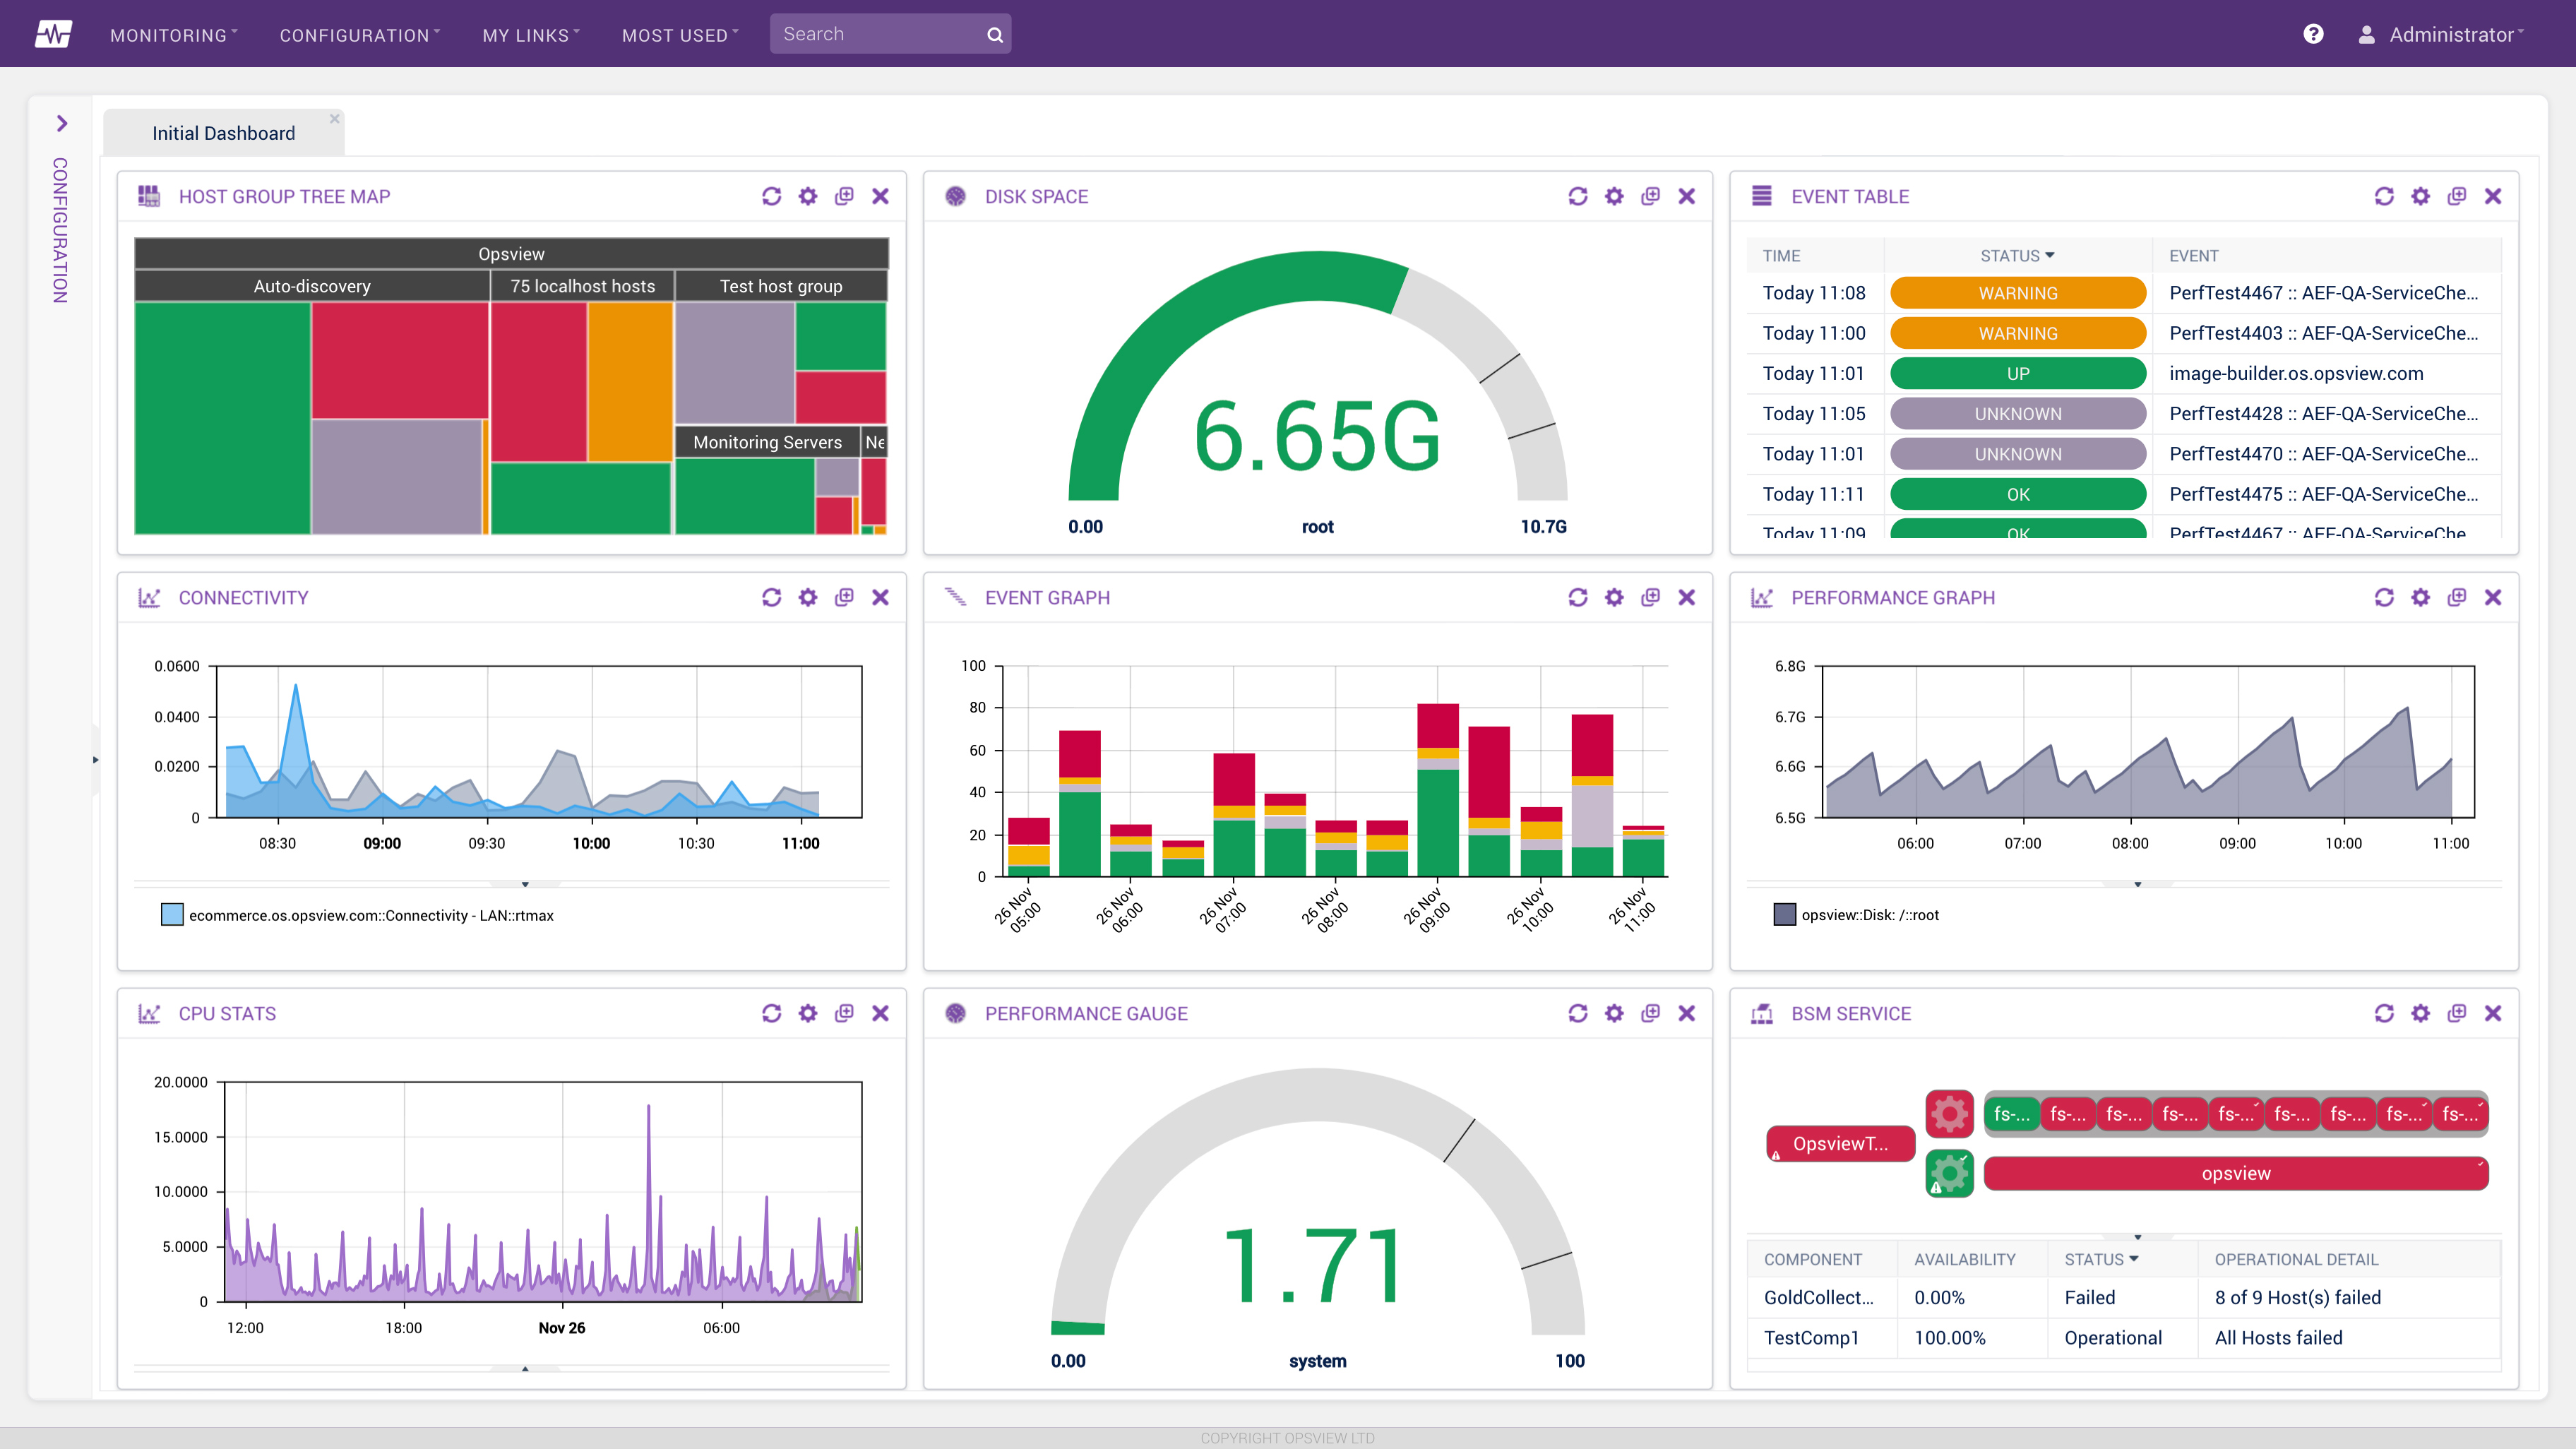
Dashboards show visualized data using charts and tables. It is also considered a process oriented system, where images are used to easily understand the flow of a company’s business practices. Employees and decision makers use these visual representations to monitor the status of their company against established goals and industry benchmarks. It should contain the following: charts and impact metrics, icons, images, drawing objects and organizers.
Fun Fact: The average person makes an estimated 35,000 decisions each day. Having the right data that is easy to read helps make better choices.
• Visual KPIs all at once: Employees are able to look into the big picture to correlate any impact (positive or negative) alongside specific KPIs to understand what’s working and what’s not. The dashboard stores data all in one place. They are also able to compare data from different areas in a single visualization. Being all to view all KPIs and comparing, users can make adjustments to their business processes in current time.
• Make data easier to understand: As mentioned before, data dashboards display KPIs and other visual metrics such as, tables, line charts and bar charts. It has the ability to add colors, symbols and visualizations to emphasize important data. This allows for employees to quickly scan and look for the data they need. Visualization helps data analysts and non- technical users to understand metrics and where they are in terms of goals and KPIs.
• Create reports quickly: Time saving becomes easy when having access to dashboard reporting visualizations. Data dashboards have the automatic ability to get the data, create a spreadsheet, generate and design the report and share it. By investing in setting up dashboards, you no longer will need to gather, analyze and format data manually. All of those functions can be done automatically with this intelligent feature.
Are you struggling with creating dashboards in Acumatica? Visit How to Set Up Dashboards in Acumatica where we take you step by step on how to create them,
As you can see, the benefits and the features can streamline business workflow and save time. Dashboard Reporting Visualizations are the new feature of the future. If you would like more information or to schedule a demo, please email info@4acc.com or give us a call at 856-335-1010.
Solutions by Industry
What's New
Outgrowing Your ERP? Why Acumatica is the Upgrade You Need
Read MoreSubmitted by Stephanie Dean on Thu, 06/26/25 - 15:52

Why You Should Make the Switch: NetSuite to Acumatica
Read MoreSubmitted by Stephanie Dean on Tue, 06/17/25 - 13:36
Acumatica ERP for Sustainable Businesses
Read MoreSubmitted by Stephanie Dean on Thu, 05/29/25 - 10:37